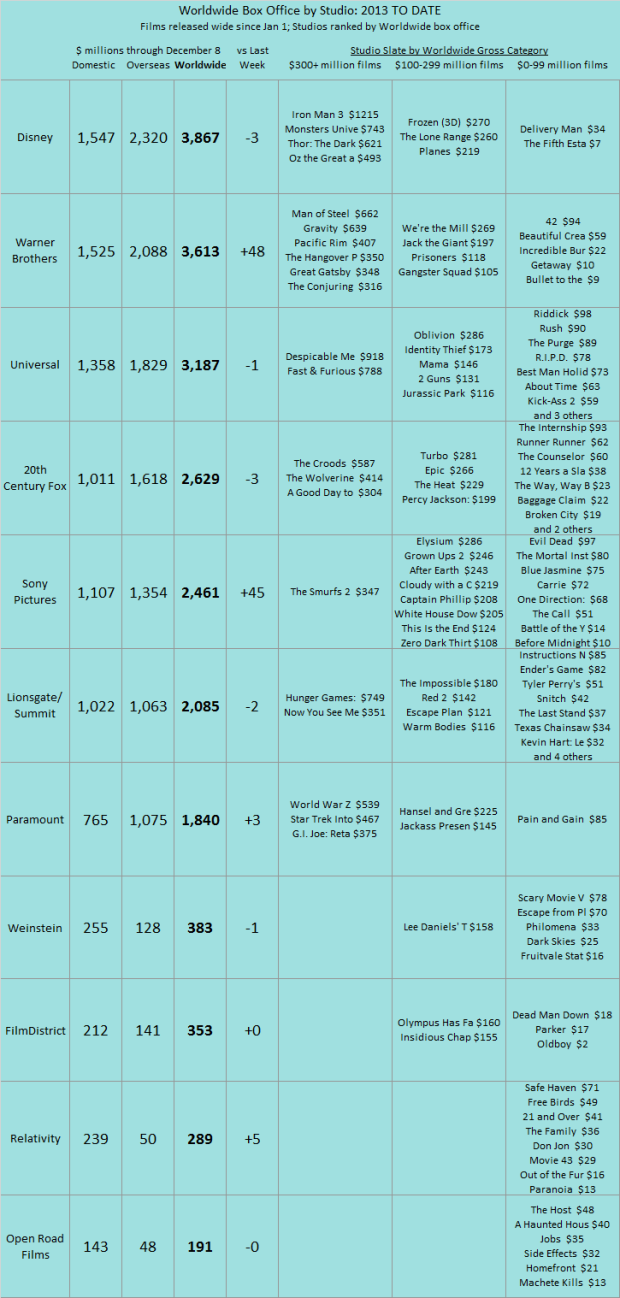
The year-to-date rankings are very similar to last week, with some studios showing small negative changes versus last week’s totals (as the final domestic estimates for some films have been adjusted downward). For a complete ranking of 2013 films individually by worldwide performance click here.
TOTAL NORTH AMERICAN BOX OFFICE. Looking at wide-release films in North America (those that play on at least 400 screens at some point), 2013 totals $9.3 billion, virtually even with last year’s pace and 3% above the prior four-year average 2009-2012 ($9.011 billion). Each year-to-date period below is defined as the first Monday after New Year’s Day through the most recent Sunday. The past week generated $122 million in wide-release North American box office, matching the 2009-2012 average for the same week ($122 million) and 16% below the same week last year ($146 million). (The most recent week’s numbers are based on weekend estimates, which are usually at worst a couple of percentage points off from the final weekend tallies.)
| North American Box Office YEAR TO DATE | ||
| (billions) | Weeks 1-48 | |
| 2013 | $9.300 | Jan 7-Dec 8 |
| 2012 | $9.345 | Jan 2-Dec 2 |
| 2011 | $8.702 | Jan 3-Dec 4 |
| 2010 | $8.949 | Jan 4-Dec 5 |
| 2009 | $9.049 | Jan 5-Dec 6 |
Over the past six weeks, 2013 is now 2% below the same six weeks in 2012 and 9% above the four-year average in the same time frame ($1.128 billion).
| North American Box Office LAST SIX WEEKS | ||
| (billions) | Weeks 43-48 | |
| 2013 | $1.231 | Oct 28-Dec 8 |
| 2012 | $1.259 | Oct 22-Dec 2 |
| 2011 | $1.026 | Oct 24-Dec 4 |
| 2010 | $1.060 | Oct 25-Dec 5 |
| 2009 | $1.165 | Oct 26-Dec 6 |


