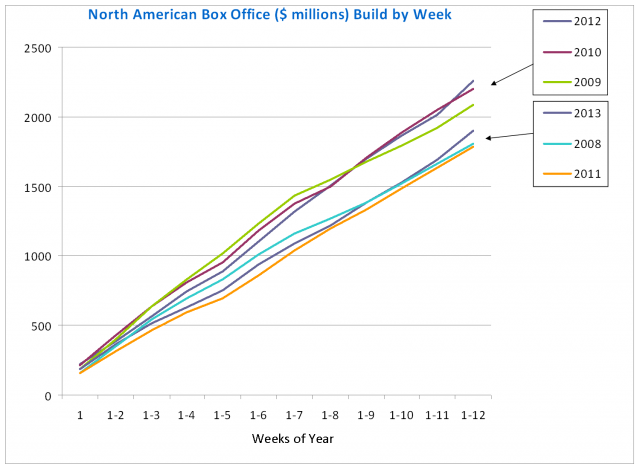
With March in the books, the North American box office is showing some signs of life. Through 12 weeks (84 days), 2013 totals $1.898 billion (looking at wide-release films playing on at least 400 screens). 2013-to-date is making a slight move away from the same period in the truly dreadful years of 2008 ($1.803 billion) and 2011 ($1.782 billion), thanks to decent performances from Oz the Great and Powerful, The Croods and G.I. Joe: Retaliation.
2013 is still way off the pace of 2012 ($2.253 billion) and 2010 ($2.197 billion) but getting a little closer to 2009 ($2.083 billion), which was starting to sputter this time of year.
Although it appears on the chart above that the uptick in 2013 is mainly a funtion of this past week, the box office has been steadily showing signs of momentum throughout March. Three of the last four weeks have been above the multi-year average for the comparable weeks. Last week was 22% above the norm, the week of March 18 was 12% above the norm, and the week of March 4 was 4% above. The only down week in the past month (March 11-17) was only 2% below the norm. The comparisons are not so rosy when we only compare to last year, which of course was fueled by The Hunger Games. But the habit of comparing the current only to the prior year is a bizarre fetish and yields a very myopic view. Looking at the broader context, 2013 has no realistic shot of catching 2012, but it might be able to break free of the horrible track of 2011 or 2008.
As a reminder, the higher-level years finished around $10 billion for the full year: $10.15 billion in 2012, $10.05 billion in 2009 and $9.81 billion in 2010. The down years ended up in the low-$9 billion range: $9.49 billion in 2011 and $9.11 billion in 2008.
Note: the ShowbuzzDaily box office totals include wide release films (films that played at some point over 400 screens and usually represent about 85% of total box office). Each year is defined as starting the first Monday after New Year’s Day, and each period in the chart above is the first 84 days (12 weeks) after that starting date. 2008 is Jan 7-Mar 30. 2009 is Jan 5-Mar 29. 2010 is Jan 4-Mar 28. 2011 is Jan 3-Mar 27. 2012 is Jan 2-Mar 25. 2013 is Jan 7-Mar 31.


