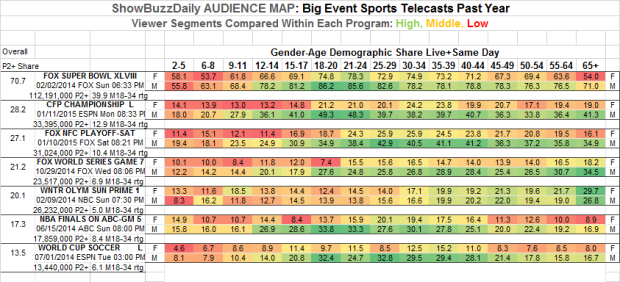
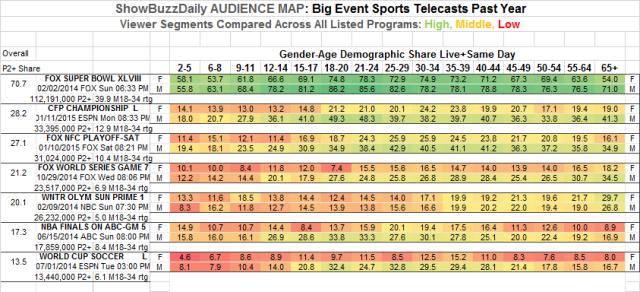
Today we continue our AUDIENCE MAP series, which started with a look at the debut of FOX’s Empire and the premiere night trends for American Idol. This week we take a look at some of the biggest sports telecasts in the past 12 months. As a reminder, the audience shares for 30 distinct gender-age groups are displayed for each program below, along with listings of some more traditional summary ratings (in this case the number of viewers ages 2+ in an average minute of the show and the men 18-34 rating, a key sales demographic for sports programming).
Of course, the king of all TV telecasts is the Super Bowl, which tops our chart below. Pretty amazing when the worst demographic performance is a 53.7 share (with girls 6-8 years old). (This still-amazing 53.7 share is colored red in the chart below because only the viewing levels for the Super Bowl are being compared against each other. Stay tuned for a different way to view the data.) The peak viewing for the Super Bowl comes with men 18-20 years old (86.2 share), and everything in between adds up to a 70.7 share with all viewers 2+ (expressed another way as 112 million viewers 2+) and just under a monumental 40 rating with men 18-34. It doesn’t get any better than that.
The recent College Football National Championship (the first in the post-BCS playoff era) managed to beat a recent NFL playoff game (a divisional round contest two nights before on FOX), and it’s truly impressive how well the college championship did with 12-24 year old males, easily beating the recent NFL playoff game with these young viewers and almost hitting 50 shares with college age men.
World Series Game 7 and one of the better rated nights from the Sochi Winter Olympics (mostly ice dancing and men’s downhill) form the next tier of events, with around 25 million viewers each. But the chart above shows how the young male skew of football gives way to the older male skew of baseball and the generally older skew of the Olympics (basically 35+ and equally male and female).
NBA Finals Game 5 (the deciding game last year) was under 20 million viewers, but for a sports advertiser it was the “right” 17.8 million: basically males 12-44, as the concentration of green clearly demonstrates. The final event listed from 2014 is from the FIFA World Cup, the elimination game for USA soccer (a defeat to Belgium in the Round of 16). Not impressed with 13.4 million viewers? Consider the match aired on a weekday afternoon in the middle of the summer, that the male 18-44 shares resemble the NBA Finals game’s profile, and that the men 18-34 rating ended up beating the Olympics telecast that had the huge advantage of airing in prime time on a Sunday night in February (one of the most viewer-rich time periods in the entire year).
As we said, the chart above color-codes the high and low viewing levels within each program separately. Another way to look at is to use the same color scheme but compare all the shows against each other. Naturally, the Super Bowl dominates the dark green/above average shading in the chart below. But look toward the bottom in the NBA Finals and World Cup sections: if you look at the young male groups you’ll see just how competitive these sports really are with the other marquee events, standing up to or beating everything other than the Super Bowl with the next generation of sports viewers.
We will continue this Audience Map series later this week with a look at ABC’s prime time schedule.
Related Posts
-
SKEDBALL: World Series Ratings through Game 5
World Series Ratings Game by Game World Series Ratings Games 1-5 Averaged Together ###
-
WEDNESDAY Ratings
Preliminary ratings are delayed by Nielsen until at least 9:30 am PT (90 minutes past due). The ratings service is performing extra “quality checks,” so be prepared for unusually high quality ratings later this morning!
-
The Sked: MONDAY Ratings Chart
Monday ratings last night, last year and last week:
-
The Sked: MONDAY Ratings Chart
Monday ratings last night, last year and last week.
-
SKEDBALL: Weekend Sports TV Ratings
The ratings below are household ratings from the 56 television markets with local Nielsen meters for Saturday November 2 and Sunday November 3, 2013. (The 56 markets out of 210 total cover about 70% of the US television population.) College Football Week 10 Top Games on Saturday 5.4 rating…


