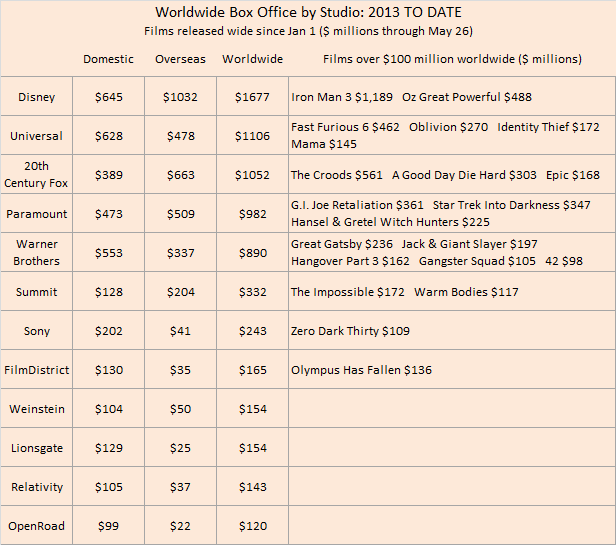
STUDIO SCORECARD. Disney remains in the #1 spot in the worldwide box office chart for 2013, but Universal has moved into second place with strong domestic and international performance from Fast & Furious 6. Imagine if the studio could produce and distribute more films that overseas audiences wanted to see. Some studios have slates that significantly over-perform the domestic grosses (Disney’s overseas total is 1.6 times domestic, 20th Century Fox is a very good 1.7 times, and even Summit has a 1.6 overseas performance factor). But Universal (0.76 overseas performance factor) and Warner Brothers (a very bad 0.61) are really hampered by films that don’t travel as well.
Looking at wide-release films in North America (those that play on at least 400 screens at some point), 2013 now totals just over $3.4 billion, now down 9% from 2012 and down only 2% from the prior four-year average 2009-2012. Each year-to-date period below is defined as the first Monday after New Year’s Day through the most recent Sunday. The past week generated an amazing $318 million in wide-release North American box office, up 69% from the same week last year but up 59% from the 2009-2012 average for the same week. (The most recent week’s numbers are based on weekend estimates, which are usually at worst a couple of percentage points of the final weekend tallies.)
| North American Box Office YEAR TO DATE | ||
| (billions) | Weeks 1-20 | |
| 2012 | $3.786 | Jan 2-May 20 |
| 2010 | $3.551 | Jan 4-May 23 |
| 2009 | $3.496 | Jan 5-May 24 |
| 2013 | $3.443 | Jan 7-May 26 |
| 2011 | $3.174 | Jan 3-May 22 |
Over the past six weeks, 2013 is now 4% above the same six weeks in 2012 and up 14% from the four-year average in the same time frame.
| North American Box Office LAST SIX WEEKS | ||
| (billions) | Weeks 15-20 | |
| 2013 | $1.211 | Apr 15-May 26 |
| 2012 | $1.162 | Apr 9-May 20 |
| 2011 | $1.102 | Apr 11-May 22 |
| 2009 | $1.055 | Apr 13-May 24 |
| 2010 | $.933 | Apr 12-May 23 |


