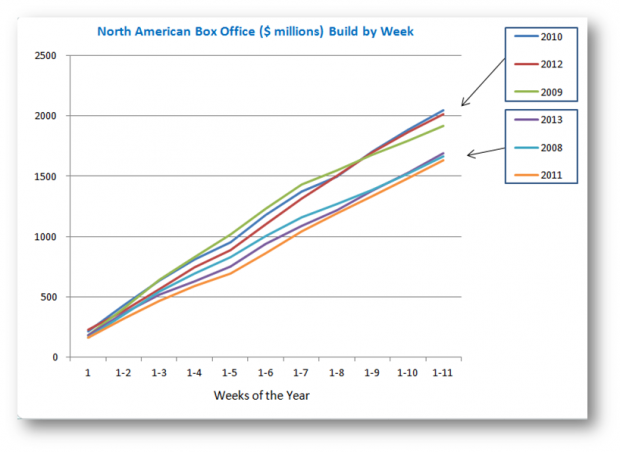
2013 remains solidly on the same pace as the other second-tier years recently. Through 11 weeks, 2013 totals $1.692 billion for wide-release films in North America (those playing at more than 400 screens). 2008 was $1.664 billion at this point, while 2011 was $1.634 billion.
The top-shelf years were already at or near $2 billion total at this point: 2010 ($2.046 billion), 2012 ($2.016 billion) and 2009 ($1.917 billion).
As a reminder, the higher-level years finished around $10 billion for the full year: $10.15 billion in 2012, $10.05 billion in 2009 and $9.81 billion in 2010. The down years ended up in the low-$9 billion range: $9.49 billion in 2011 and $9.11 billion in 2008.
Note: the ShowbuzzDaily box office totals include wide release films (films that played at some point over 400 screens and usually represent about 85% of total box office). Each year is defined as starting the first Monday in January, and each period in the chart above is the first 77 days (11 weeks) after that starting date. 2008 is Jan 7-Mar 23. 2009 is Jan 5-Mar 22. 2010 is Jan 4-Mar 21. 2011 is Jan 3-Mar 20. 2012 is Jan 2-Mar 18. 2013 is Jan 7-Mar 24.


