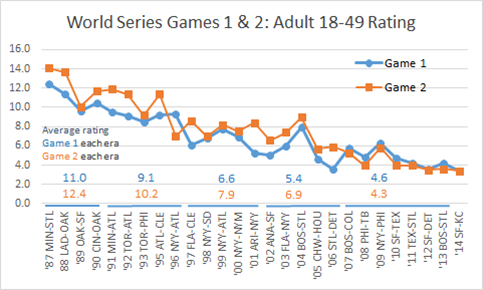
Game 2 of the World Series Wednesday night on FOX averaged a 3.4 adult 18-49, matching Game 1’s young adult rating. Actually, if we look at the rating to two decimal places rather than the archaic one-tenth of a rating point, Game 2 (3.40) is slightly ahead of Game 1 (3.38). But any reasonable person would say they are the same number, and both are record lows for their respective Games.
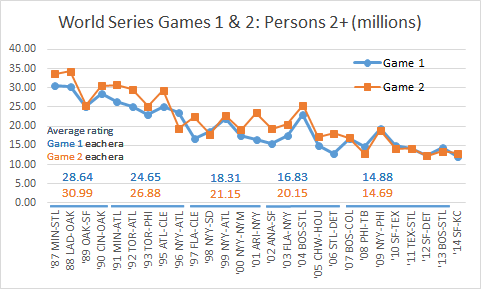
Today, we are providing the same historical chart of the early World Series games with the broader measure of persons 2+ (the total audience). The pattern is nearly identical to the 18-49 chart. If the World Series were a stock, just about any analyst, technical or fundamental, would scream “Sell!” looking at these trendlines. Last night, Game 2 averaged 12,917,000 persons 2+, up slightly from 12,191,000 for Game 1. Although Game 1 was a record low with the persons 2+ measurement, MLB can rejoice that last night was not the least-viewed Game 2 in history. That distinction remains with Game 2 in 2012 between San Francisco and Detroit (12,343,000). So I guess things could be worse for national baseball ratings.
The tables below tracking the recent six years have also been updated. The series moves to San Francisco Friday-Sunday. Check back for continued updates.
| World Series TV Ratings by Game Since 2009 (Live+Same Day) | ||||||||
| A18-49 Rating | G1 | G2 | G3 | G4 | G5 | G6 | G7 | |
| 2009 | NYY-PHI | 6.3 | 5.8 | 4.7 | 7.8 | 5.3 | 7.4 | |
| 2010 | TEX-SF | 4.7 | 4.0 | 2.9 | 4.3 | 4.2 | ||
| 2011 | TEX-STL | 4.2 | 4.0 | 3.2 | 4.2 | 4.2 | 6.5 | 7.4 |
| 2012 | DET-SF | 3.6 | 3.5 | 2.8 | 4.7 | |||
| 2013 | BOS-STL | 4.2 | 3.6 | 3.3 | 4.6 | 4.1 | 5.7 | |
| 2014 | KC-SF | 3.4 | 3.4 | |||||
| P2+ (millions) | G1 | G2 | G3 | G4 | G5 | G6 | G7 | |
| 2009 | NYY-PHI | 19.51 | 18.90 | 15.40 | 22.76 | 17.09 | 22.34 | |
| 2010 | TEX-SF | 15.01 | 14.13 | 11.46 | 15.54 | 14.95 | ||
| 2011 | TEX-STL | 14.17 | 14.28 | 11.20 | 15.16 | 14.32 | 21.06 | 25.40 |
| 2012 | DET-SF | 12.24 | 12.34 | 10.47 | 15.49 | |||
| 2013 | BOS-STL | 14.40 | 13.43 | 12.47 | 15.98 | 14.45 | 19.18 | |
| 2014 | KC-SF | 12.19 | 12.92 | |||||
Related Posts
-
SKEDBALL: World Series Ratings through Game 5
World Series Ratings Game by Game World Series Ratings Games 1-5 Averaged Together ###
-
SKEDBALL: World Series Ratings through Game 3
World Series Game Track. In the official nationals for Friday 10.30.2015, World Series Game 3 averaged 13.2 million viewers 2+ (above the 12.5 million average for Game 3 since 2006) but the adult 18-49 rating (3.2) was below the Game 3 average (3.6), as the median age of Game 3 crept…
-
SKEDBALL: World Series Ratings through Game 3
Game 3 of the World Series Friday night on FOX averaged a 3.1 adult 18-49 (3.08 more precisely) in the official national ratings, below the recent 2007-2013 average of a 3.5 adult 18-49 rating for Game 3 but above the previous lows for Game 3 in 2012 (2.8) and 2010 (2.9), also…
-
SKEDBALL: World Series Ratings through Game 5
Game 4 of the World Series Saturday night averaged a 2.6 adult 18-49 rating, well below the previous record low for Game 4 (a 4.2 in 2011 for Texas-St. Louis). Game 5 on Sunday (with many more available viewers) went up to a 3.3 adult 18-49 rating, well below the previous…
-
SKEDBALL: Weekend Sports TV Ratings
The ratings below are household ratings from the 56 television markets with local Nielsen meters for Saturday January 11 and Sunday January 12, 2014. The 56 markets (out of 210 total) cover about 70% of the US television population. NFL Playoffs: Divisional Weekend Saturday 19.5 rating FOX 4:30 NFC New…


