

Articles
Full Story »
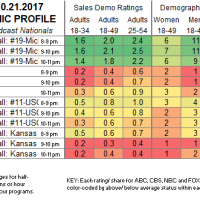
The Sked: Saturday Network Scorecard 10.21.2017
Posted October 22, 2017 by Mitch Metcalf
DEMOGRAPHIC DETAIL: For each broadcast program (or hour segment), the chart below displays preliminary key advertiser demographics (adult 18-34, 18-49 and 25-54 ratings), audience skews (women 18-49, men 18-49 and adults 50+ shares) and total viewership (thousands of people over the age of 2). PREVIOUS SATURDAY NETWORK SCORECARDS (FAST NATIONALS) PREVIOUS SATURDAY CABLE & BROADCAST NATIONALS […]
Articles
Full Story »
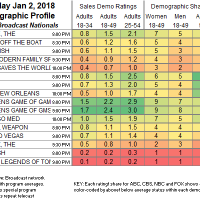
UPDATED: SHOWBUZZDAILY’s Top 150 Tuesday Cable Originals & Network Finals: 1.2.2018
Posted January 4, 2018 by Mitch Metcalf
NETWORK FINALS: BULL gained 0.1 in final numbers. Broadcast Official Nationals Program Ratings Chart CABLE HIGHLIGHTS: History’s CURSE OF OAK ISLAND returned from holiday break to lead Tuesday cable at 0.84, and lead-out HUNTING HITLER was at 0.47. USA’s WWE SMACKDOWN was steady at 0.82. […]

Articles
Full Story »
THE SKED NETWORK SCORECARD – 9/14/14
Posted September 15, 2014 by Mitch Metcalf
Now that NFL football has returned to Sundays, the weekly ratings for NBC, FOX and CBS will be subject to more than the usual amount of adjustments, and we won’t know exactly where those networks stand until final ratings are released on Tuesday morning. NBC: Preliminary numbers for NFL SUNDAY NIGHT FOOTBALL have the […]

Articles
Full Story »
THE SKED: 1st Pre-Look At CBS’s New Dramas
Posted May 19, 2011 by Mitch Salem
>DISCLAIMER: These initial impressions are based on the clips (usually 3-5 minutes) released by the networks to use in their Upfront presentations and for promos. They’re chosen to sell the show, not to accurately represent it. So take the reactions below with a large satchel of salt–we may well feel differently about these shows once […]
Articles
Full Story »
THE SKED PILOT REPORT: ABC’s “Pan Am” – PREMIERING TONIGHT
Posted September 25, 2011 by Mitch Salem
> Disclaimer: Network pilots now in circulation are not necessarily in the form that will air in the Fall. Pilots are often reedited and rescored, and in some cases even recast or reshot. So these critiques shouldn’t be taken as full TV pilot reviews, but rather as a guide to the general style and content […]
Articles
Full Story »
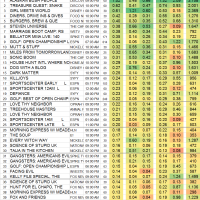
SHOWBUZZDAILY’s Top 100 Friday Cable Originals (& Network Update): 7.17.2015
Posted July 20, 2015 by Mitch Metcalf
NETWORK UPDATE: The only change from preliminary numbers was a 0.1 reduction for the SHARK TANK rerun. CABLE HIGHLIGHTS: Discovery held the top 2 slots on Friday cable with ALASKAN BUSH PEOPLE (preempted for Shark Week, it rose 0.22 from 2 weeks ago to 1.02) and TREASURE QUEST at 0.62. Disney Channel’s GIRL MEETS WORLD gained 0.13 […]
Articles
Full Story »
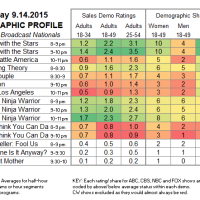
The Sked: Monday Ratings 9.14.2015
Posted September 15, 2015 by Mitch Metcalf
DEMOGRAPHIC DETAIL: For each broadcast program (or hour segment), the chart below displays preliminary key advertiser demographics (adult 18-34, 18-49 and 25-54 ratings), audience skews (women 18-49, men 18-49 and adults 50+ shares) and total viewership (thousands of people over the age of 2). NOTE: ABC fast nationals inflated by local NFL Monday Night Football pre-emption […]
Articles
Full Story »
The Sked: SUNDAY RATINGS March 18
Posted March 19, 2012 by Mitch Metcalf
>Another weak Sunday night on network television. CBS narrowly won the night with Adults 18-49 in the preliminary fast nationals, thanks to coverage of the NCAA Basketball Tournament until 7:43 pm. ABC was down from last week, mostly because of a disappointing third-week performance from GCB (down to a 2.0 rating, though that was enough […]