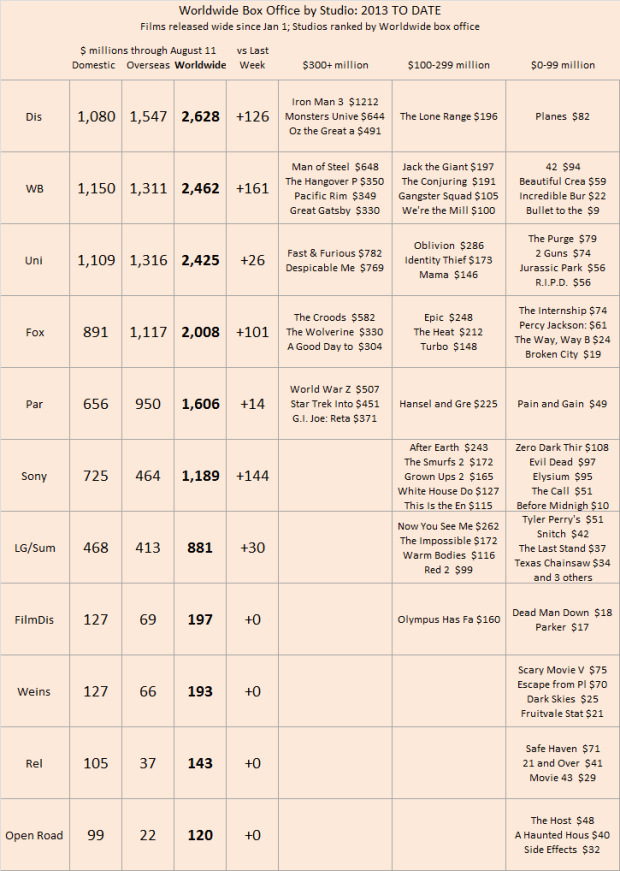
STUDIO SCORECARD. Warner Brothers has moved past Universal to take the #2 spot on the worldwide box office chart for 2013. The opening of We’re the Millers and continued overseas strength from Pacific Rim and to a lesser extent The Conjuring powered Warner Brothers to the best week of the studios.
Reminder: the chart below has been reformatted and expanded to include a look at all releases from each studio, divided into three buckets: worldwide grosses of over $300 million, grosses between $100 million and $299 million, and films under $100 million worldwide.
TOTAL NORTH AMERICAN BOX OFFICE. Looking at wide-release films in North America (those that play on at least 400 screens at some point), 2013 now totals over $6.5 billion, once again ahead of 2012’s pace (by a mere 1%) and still 4% above the prior four-year average 2009-2012. Each year-to-date period below is defined as the first Monday after New Year’s Day through the most recent Sunday. The past week generated a solid $232 million in wide-release North American box office, up 25% from the same week last year and up a smaller but still sizable 11% from the 2009-2012 average for the same week. (The most recent week’s numbers are based on weekend estimates, which are usually at worst a couple of percentage points off from the final weekend tallies.)
| North American Box Office YEAR TO DATE | ||
| (billions) | Weeks 1-31 | |
| 2013 | $6.525 | Jan 7-Aug 11 |
| 2012 | $6.485 | Jan 2-Aug 5 |
| 2010 | $6.307 | Jan 4-Aug 8 |
| 2009 | $6.255 | Jan 5-Aug 9 |
| 2011 | $6.099 | Jan 3-Aug 7 |
Over the past six weeks, 2013 is now only 3% above the same six weeks in 2012 and up 6% from the four-year average in the same time frame.
| North American Box Office LAST SIX WEEKS | ||
| (billions) | Weeks 26-31 | |
| 2011 | $1.726 | June 27-Aug 7 |
| 2013 | $1.717 | July 1-Aug 11 |
| 2012 | $1.660 | June 25-Aug 5 |
| 2010 | $1.625 | June 28-Aug 8 |
| 2009 | $1.471 | June 29-Aug 9 |


