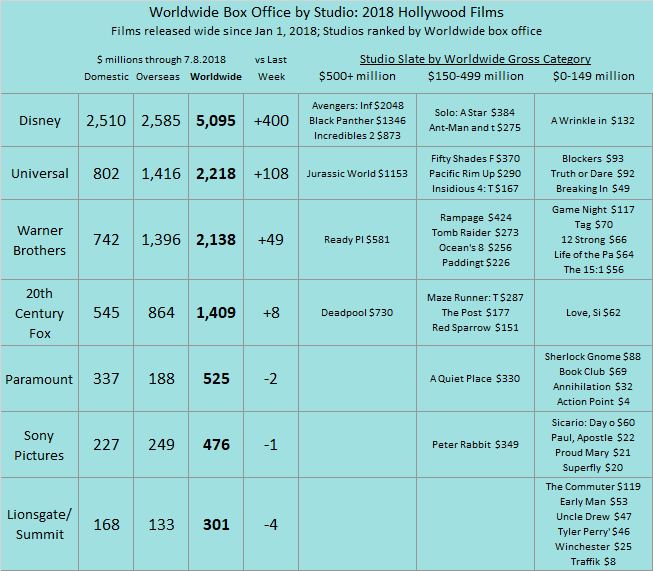
WORLDWIDE STUDIO SCORECARD. Here is an updated look at the 2018 film slates by studio. The studio totals also include 2018 dollars for films released in late 2017.
YEAR TO DATE BOX OFFICE. Looking at North American box office, 2018 to date is now +10% above last year and still +14% above the average for this point the past four years ($5.477 billion). Over the same period, Hollywood films have grossed almost $15.3 billion worldwide when we add overseas box office (that’s now -4% below the comparable worldwide box office last year at this stage but +8% above 2016).
A reminder: we define the start of each year as the first Monday in January, and our year ends on the Sunday after New Year’s Day the following calendar year. (The most recent week’s numbers are based on weekend estimates, which are usually at worst a couple of percentage points off from the final weekend tallies.) The numbers in this chart contain box office grosses from each year’s films as well as grosses from prior year films that carried over into that year.
| Box Office YEAR TO DATE | |||
| (billions) | Weeks 1-27 | ||
| North America | Worldwide | ||
| 2018 | $6.228 | $15.276 | Jan 1-July 8 |
| 2017 | $5.678 | $15.849 | Jan 2-July 9 |
| 2016 | $5.535 | $14.128 | Jan 4-July 10 |
| 2015 | $5.541 | $14.559 | Jan 5-July 12 |
| 2014 | $5.153 | $13.546 | Jan 6-July 13 |
The past six weeks in North America are now +10% above the same period last year and now +8% above the four-year average for the similar six-week period ($1.541 billion).
| North American Box Office PAST SIX WEEKS | ||
| (billions) | ||
| 2018 | $1.661 | since May 28 |
| 2017 | $1.515 | since May 29 |
| 2016 | $1.604 | since May 30 |
| 2015 | $1.669 | since June 1 |
| 2014 | $1.377 | since June 2 |
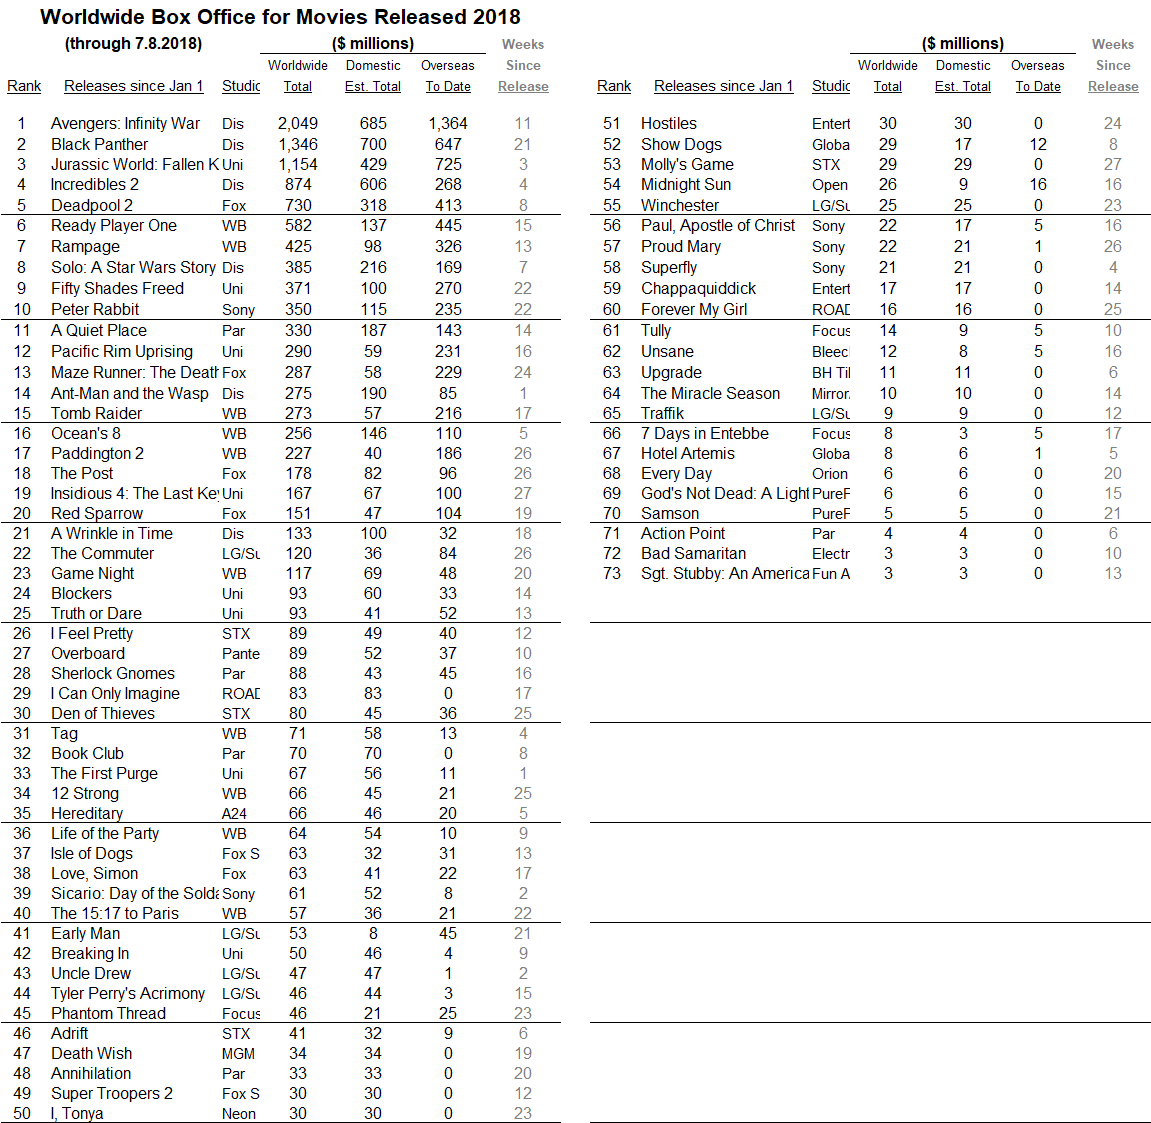
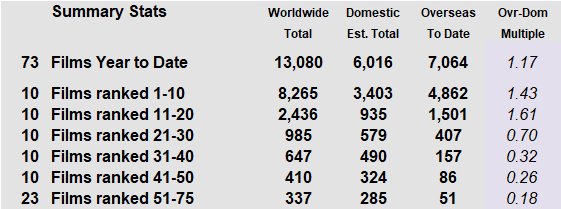
WORLDWIDE GROSSES BY FILM TITLE. Here is an updated look at the 2018 film rankings for movies released in over 1,000 North American theaters since January 1.
PREVIOUS WORLDWIDE STUDIO SCORECARDS
###


