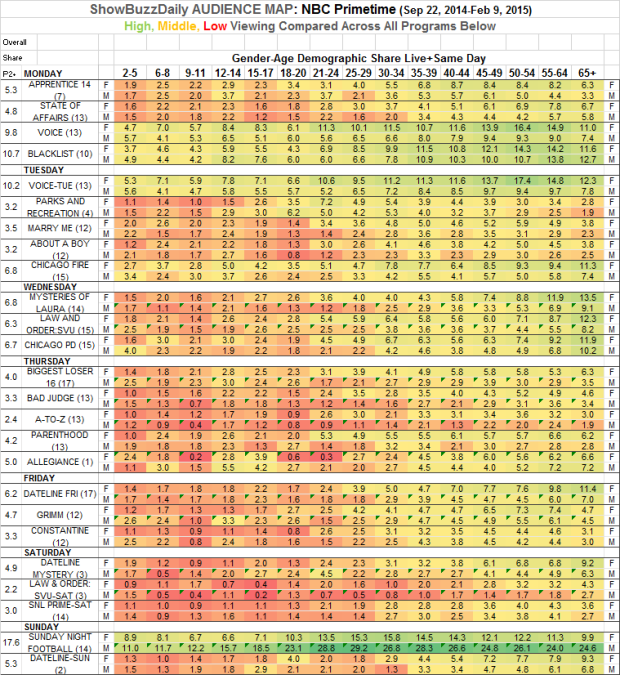
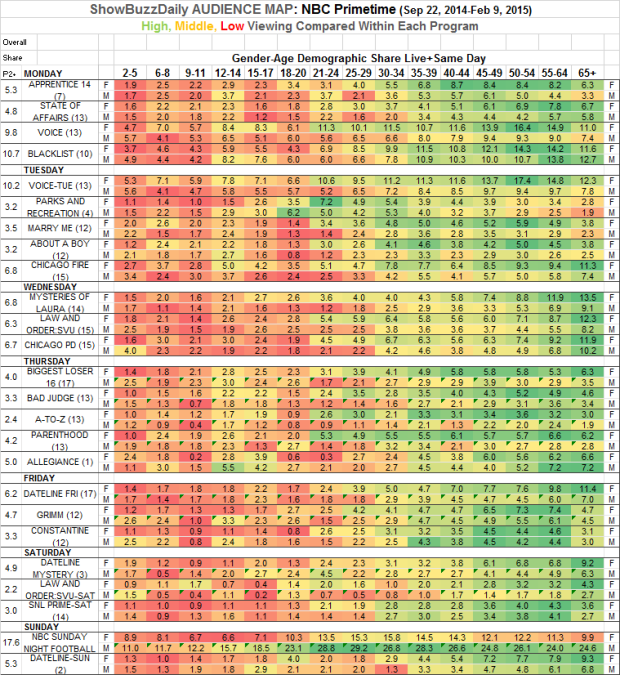
The AUDIENCE MAP series continues with a look at the detailed demographics for NBC’s primetime schedule for this season to date. As a reminder, the audience shares for 30 distinct gender-age groups are displayed for each program below. Programs in the chart are grouped by night so you can see the audience flow from 8:00 pm/ 7:00C to 11:00 pm/10:00C. Also, we have added the number of telecasts after each program title in the chart below. The telecast count represents the number of original and repeat telecasts in the average for each show. Programs that have aired on multiple nights are condensed into one number. For example, the 10 episodes of The Blacklist include 8 Monday telecasts, 1 Sunday telecast and 1 Thursday telecast below. The show remains listed on Monday since that is the predominant night of the week this season.
NBC is a really tale of two schedules. Nights with the NFL, The Voice and The Blacklist offer green (above average) boxes in the chart below, representing double-digit shares that extend into a broad range of viewers of all ages. And then there’s the worst of times. All the other time periods and nights are a hot mess. At best, some programs turn green but only with viewers over 50 or 65 (mainly procedural dramas from Dick Wolf). Moreover, the rest of the schedule is stuck in the yellows and reds with young adults, low single-digit demographic shares as far as the eye can see.
How does your favorite NBC show look? Check it out below.
The chart above color codes the audience segments by comparing the viewing levels of all the NBC shows against each other, across the entire primetime schedule. In contrast, the chart below color codes the audience segments show by show, by comparing the viewing levels within each show individually. Even a show like A to Z boasts green boxes in the chart below, because that 3.6 share with women 50-54 is, well, as good as it gets for that program. The data in both charts are the same — the color comparisons are just presenting different angles. Use the one that best meets your needs or preferences.
Coming next week: the AUDIENCE MAP for next week has not yet been selected. Have an idea for the next Map? Post it in the comment section below.
Also, visit other AUDIENCE MAP posts.
Related Posts
-
AUDIENCE MAP: NBC Fall 2015
The AUDIENCE MAP series continues with a look at fall 2015: NBC’s primetime lineup is shown below. As a reminder, the programs are arranged by broadcast schedule, with each show placed on the night it spent most of the season so far. The audience share for each of 30 gender-age subgroups…
-
AUDIENCE MAP: CBS Primetime
The AUDIENCE MAP series continues with a look at the detailed demographics for CBS’s primetime schedule for this season to date. As a reminder, the audience shares for 30 distinct gender-age groups are displayed for each program below. Programs in the chart are grouped by night so you can see…
-
WEDNESDAY Ratings
Preliminary ratings are delayed by Nielsen until at least 9:30 am PT (90 minutes past due). The ratings service is performing extra “quality checks,” so be prepared for unusually high quality ratings later this morning!
-
AUDIENCE MAP: FOX Primetime
The AUDIENCE MAP series continues with a look at the detailed demographics for FOX’s primetime schedule for this season to date. As a reminder, the audience shares for 30 distinct gender-age groups are displayed for each program below. Programs in the chart are grouped by night so you can see…
-
AUDIENCE MAP: NBC Primetime Full 2014-2015 Season
The AUDIENCE MAP series continues with a look back at the complete 2014-2015 television season. NBC’s primetime lineup is shown below. As a reminder, the programs are arranged by broadcast schedule, with each show placed on the night it spent most of the season. The audience share for each of 30…


