

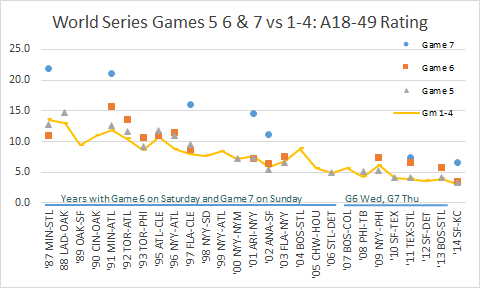
Game 7 of the World Series Wednesday night averaged a 5.6 adult 18-49 fast national rating, which we are estimating will go up to around a 6.6 6.64 adult 18-49 rating in the official nationals (after time zone adjustment for this live telecast). Another record low, but not enormously off the pace of the previous low for a Game 7 (7.4 in 2011 for Texas-St. Louis).
With the broad measure of persons 2+, Game 7 averaged a preliminary 20.2 million persons 2+ in the fast nationals, which we are estimating will rise to 23.8 23.517 million people in the official nationals later today. Previous low for Game 7: 25,400,000 in 2011 for Texas-St. Louis. There is certainly a chance 2014 could catch 2011 in the official nationals. Check back after 1 pm PT to see.
So MLB and FOX must be reasonably satisfied that World Series Game 7, one of the greatest terms and events in all of sports, still has some mojo on television. But the great flaw in the sport is that no one knows when the next Game 7 will come. Maybe next year. Probably three to five years from now. Perhaps closer to a decade away. And that just doesn’t cut it in a media and entertainment culture that is all about being on demand. Imagine if the NFL held the Super Bowl only once every four or five years on some unpredictable schedule.
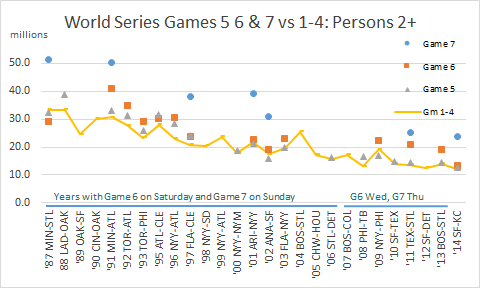
The tables below tracking the recent six years have also been updated with official Game 7 ratings for 2014.
| World Series TV Ratings by Game Since 2009 (Live+Same Day) | ||||||||
| A18-49 Rating | G1 | G2 | G3 | G4 | G5 | G6 | G7 | |
| 2009 | NYY-PHI | 6.3 | 5.8 | 4.7 | 7.8 | 5.3 | 7.4 | |
| 2010 | TEX-SF | 4.7 | 4.0 | 2.9 | 4.3 | 4.2 | ||
| 2011 | TEX-STL | 4.2 | 4.0 | 3.2 | 4.2 | 4.2 | 6.5 | 7.4 |
| 2012 | DET-SF | 3.6 | 3.5 | 2.8 | 4.7 | |||
| 2013 | BOS-STL | 4.2 | 3.6 | 3.3 | 4.6 | 4.1 | 5.7 | |
| 2014 | KC-SF | 3.4 | 3.4 | 3.1 | 2.6 | 3.3 | 3.5 | 6.6 |
| P2+ (millions) | G1 | G2 | G3 | G4 | G5 | G6 | G7 | |
| 2009 | NYY-PHI | 19.51 | 18.90 | 15.40 | 22.76 | 17.09 | 22.34 | |
| 2010 | TEX-SF | 15.01 | 14.13 | 11.46 | 15.54 | 14.95 | ||
| 2011 | TEX-STL | 14.17 | 14.28 | 11.20 | 15.16 | 14.32 | 21.06 | 25.40 |
| 2012 | DET-SF | 12.24 | 12.34 | 10.47 | 15.49 | |||
| 2013 | BOS-STL | 14.40 | 13.43 | 12.47 | 15.98 | 14.45 | 19.18 | |
| 2014 | KC-SF | 12.19 | 12.92 | 12.13 | 10.74 | 12.64 | 13.37 | 23.52 |

