

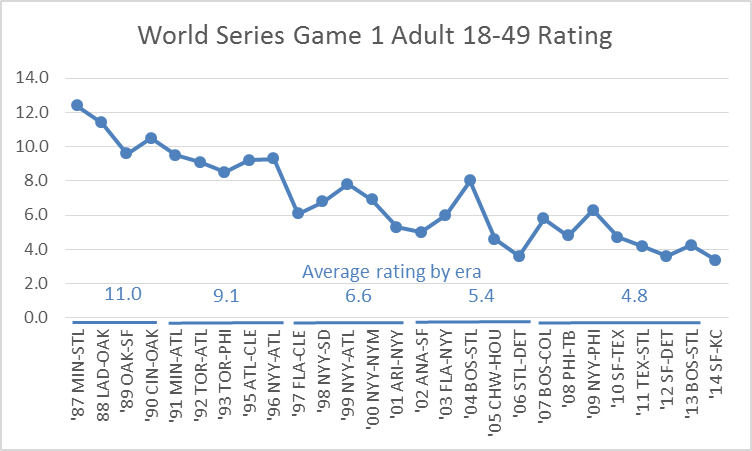
Clunk. Game 1 of the World Series averaged a 3.4 adult 18-49 rating Tuesday, setting a new record low for the opening game of the Fall Classic. The previous record low was a 3.6 in 2012 for San Francisco-Detroit and 2006 for St. Louis-Detroit. For the record, the high in the Nielsen PeopleMeter era is a 12.4 adult 18-49 rating for Game 1 of the 1987 series between Minnesota and St. Louis. On the broader measure of persons 2+, last night’s Game 1 averaged 12,191,000 people, also a new low (below the previous low in 2012 of 12,243,000 for San Francisco-Detroit). But read on: it could get a lot worse as the Series moves into this weekend.
The ratings for last six World Series, game by game, are also listed below. Game 3, which aired on the Saturday blackhole night from 2007-2013, have been the nadir of recent World Series. This year, Game 3 airs on Friday and Game 4 airs on Saturday. It could get a lot worse. If things do not go well (the Royals get steamrolled again tonight in Game 2, for example), perhaps the Series will go down to a 2.5 adult 18-49 and under 10 million viewers on Friday or Saturday for Game 3 or 4?
| World Series TV Ratings by Game Since 2009 (Live+Same Day) | ||||||||
| A18-49 Rating | G1 | G2 | G3 | G4 | G5 | G6 | G7 | |
| 2009 | NYY-PHI | 6.3 | 5.8 | 4.7 | 7.8 | 5.3 | 7.4 | |
| 2010 | TEX-SF | 4.7 | 4.0 | 2.9 | 4.3 | 4.2 | ||
| 2011 | TEX-STL | 4.2 | 4.0 | 3.2 | 4.2 | 4.2 | 6.5 | 7.4 |
| 2012 | DET-SF | 3.6 | 3.5 | 2.8 | 4.7 | |||
| 2013 | BOS-STL | 4.2 | 3.6 | 3.3 | 4.6 | 4.1 | 5.7 | |
| 2014 | KC-SF | 3.4 | ||||||
| P2+ (millions) | G1 | G2 | G3 | G4 | G5 | G6 | G7 | |
| 2009 | NYY-PHI | 19.51 | 18.90 | 15.40 | 22.76 | 17.09 | 22.34 | |
| 2010 | TEX-SF | 15.01 | 14.13 | 11.46 | 15.54 | 14.95 | ||
| 2011 | TEX-STL | 14.17 | 14.28 | 11.20 | 15.16 | 14.32 | 21.06 | 25.40 |
| 2012 | DET-SF | 12.24 | 12.34 | 10.47 | 15.49 | |||
| 2013 | BOS-STL | 14.40 | 13.43 | 12.47 | 15.98 | 14.45 | 19.18 | |
| 2014 | KC-SF | 12.19 | ||||||
Before 2007, the World Series started on Saturday for Game 1 and then had a natural build to Game 2 on Sunday, where viewers are more plentiful. Then the numbers would hold very steady on Tuesday-Thursday, which are also good nights for TV viewing. If the Series happened to go to Game 6, the dearth of available viewers on Saturday was outweighed by the excitement of a long series. And then Game 7, the holy grail for baseball fans, would normally land on viewer-rich Sunday night. Between 1987 and 1993 (the PeopleMeter era before the 1994 strike that killed the postseason that year), two Game 7’s averaged a mammoth 21.5 adult 18-49 rating and almost 51 million viewers. In the post-strike era when the series still started on Saturday (1995-2006), there were three Game 7’s played and they averaged a still potent 13.9 adult 18-49 rating and almost 36 million viewers. Since the Series started mid-week (starting Wednesdays 2007-2013 and now on Tuesdays starting this week), there has only been one Game 7: a 7.7 adult 18-49 rating and 25 million viewers. If this year’s Series ends up going to Game 7, perhaps that game could get close to 20 million. But Games 1-5 look like they are going to be a lot closer to 10 million.
| Average World Series Game Ratings in Different Recent Eras | ||||||||
| A18-49 Rating | G1 | G2 | G3 | G4 | G5 | G6 | G7 | |
| 1987-1993 | 10.1 | 11.7 | 11.5 | 11.1 | 12.2 | 12.7 | 21.5 | |
| 1995-2006 | 6.6 | 7.7 | 7.7 | 8.2 | 8.0 | 8.7 | 13.9 | |
| 2007-2013 | 4.8 | 4.3 | 3.5 | 5.4 | 4.4 | 6.5 | 7.7 | |
| P2+ (millions) | G1 | G2 | G3 | G4 | G5 | G6 | G7 | |
| 1987-1993 | 26.99 | 29.94 | 29.86 | 29.38 | 32.38 | 33.49 | 50.78 | |
| 1995-2006 | 18.72 | 21.27 | 21.21 | 22.54 | 22.08 | 24.93 | 35.96 | |
| 2007-2013 | 15.27 | 14.69 | 12.13 | 17.34 | 14.81 | 20.61 | 25.40 | |

