Game 3 of the World Series on Friday 10.28.2016 averaged just under 19.4 million persons 2+ live+same day and a stellar 5.2 persons 18-49 rating, well above the Game 3 average since 2006 (13.2 million P2+ and a 3.7 P18-49 rating) and a new high for Game 3 since 2006.
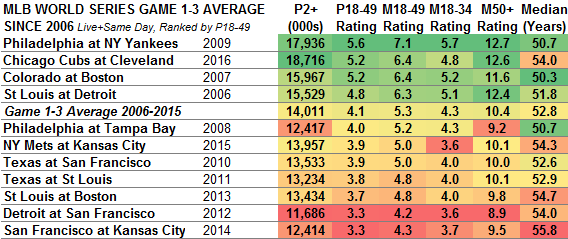
This brings the average of Games 1-3 in 2016 to 18.7 million P2+, now the best since 2006 (see chart below). The Game 1-3 average with P18-49 is now a 5.2 rating, tied for #2 since 2006 (behind only 2009’s Phillies-Yankees series). But much of that gap should close when we see the official ratings for Games 4 and 5 from Saturday and Sunday loaded into the averages tomorrow.
###
Related Posts
-
SKEDBALL: World Series Ratings through Game 5
World Series Ratings Game by Game World Series Ratings Games 1-5 Averaged Together ###
-
SKEDBALL: World Series Ratings through Game 2
Game 2 of the 2016 World Series on Wednesday October 26 averaged 17,395,000 persons 2+ live+same day and a 4.8 P18-49 rating, down from Game 1’s 19,368,000 P2+ and 5.6 P18-49 rating. On average, Game 2 declines about -2% from Game 1, but Game 2 last night dropped more than -10%…
-
SKEDBALL: World Series Game 1 Ratings (UPDATED)
UPDATE: Game 1 of the 2016 World Series averaged just under 19.4 million viewers 2+ live+same day in the official nationals, second only to 2009 (Phillies-Yankees) in the last decade (and just narrowly behind it). With the key sales demographics, the game is also well above average, generally ranking #3…
-
SKEDBALL: World Series Ratings through Game 3
World Series Game Track. In the official nationals for Friday 10.30.2015, World Series Game 3 averaged 13.2 million viewers 2+ (above the 12.5 million average for Game 3 since 2006) but the adult 18-49 rating (3.2) was below the Game 3 average (3.6), as the median age of Game 3 crept…


