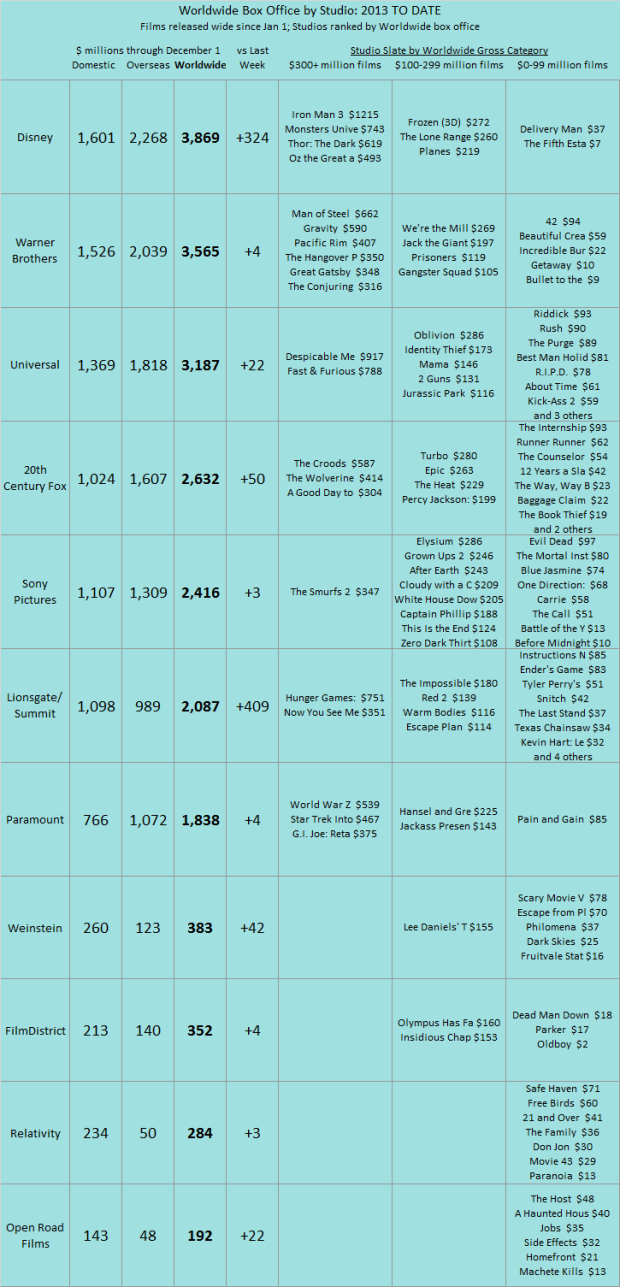
The see-saw continues in the 2013 studio rankings. Disney moved back into first (thanks to the domestic release of Frozen with overseas still to come) and Warner Brothers moved back into second place. Meanwhile continued strength from The Hunger Games: Catching Fire (a big increase in overseas grosses and an upgrade in the domestic forecast total) pushed Lionsgate/Summit to over $2 billion for the year and ahead of pseudo-studio Paramount. Finally, Philomena pushed The Weinstein Company back ahead of FilmDistrict, which got no help from Oldboy. For a complete ranking of 2013 films individually by worldwide performance click here.
TOTAL NORTH AMERICAN BOX OFFICE. Looking at wide-release films in North America (those that play on at least 400 screens at some point), 2013 totals almost $9.2 billion, virtually even with last year’s pace and 3% above the prior four-year average 2009-2012 ($8.889 billion). Each year-to-date period below is defined as the first Monday after New Year’s Day through the most recent Sunday. The past week generated $334 million in wide-release North American box office, 14% above the 2009-2012 average for the same week ($293 million) and 3% above the same week last year ($325 million). (The most recent week’s numbers are based on weekend estimates, which are usually at worst a couple of percentage points off from the final weekend tallies.)
| North American Box Office YEAR TO DATE | ||
| (billions) | Weeks 1-47 | |
| 2013 | $9.178 | Jan 7-Dec 1 |
| 2012 | $9.199 | Jan 2-Nov 25 |
| 2011 | $8.598 | Jan 3-Nov 27 |
| 2010 | $8.838 | Jan 4-Nov 28 |
| 2009 | $8.921 | Jan 5-Nov 29 |
Over the past six weeks, 2013 is now 3% below the same six weeks in 2012 and 7% above the four-year average in the same time frame ($1.156 billion).
| North American Box Office LAST SIX WEEKS | ||
| (billions) | Weeks 42-47 | |
| 2013 | $1.232 | Oct 21-Dec 1 |
| 2012 | $1.272 | Oct 15-Nov 25 |
| 2011 | $1.062 | Oct 17-Nov 27 |
| 2010 | $1.109 | Oct 18-Nov 28 |
| 2009 | $1.181 | Oct 19-Nov 29 |


