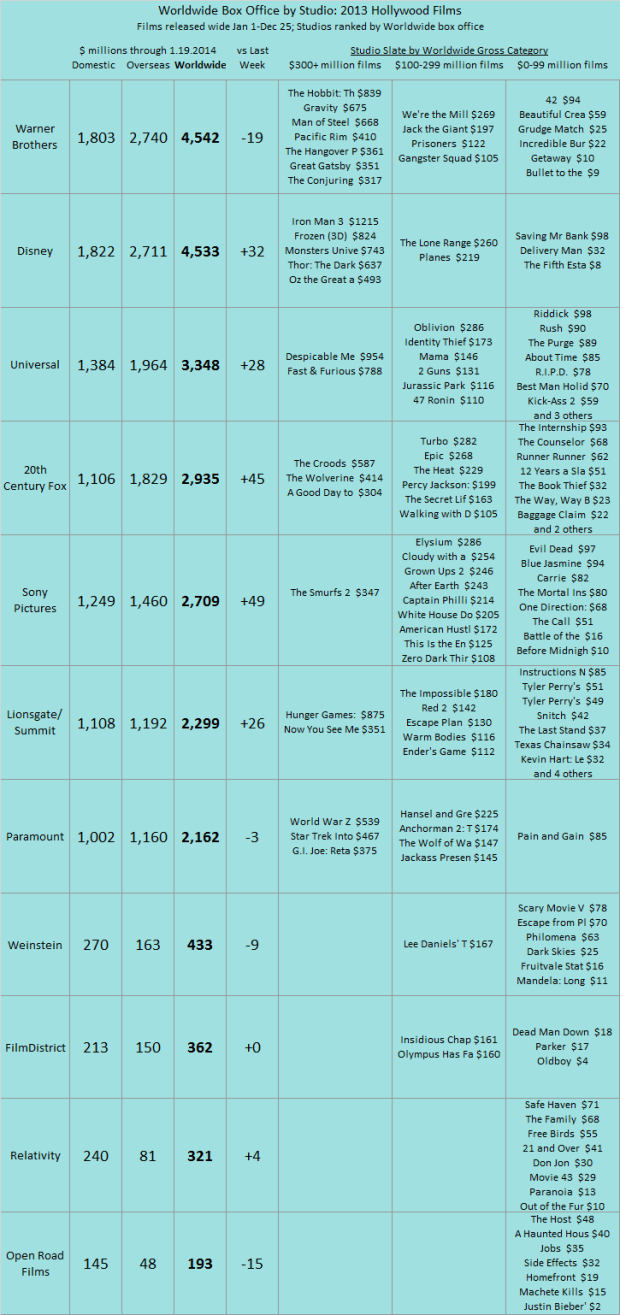
2013 is turning into a photo finish. The worldwide studio tallies below are for total box office performance of the films released wide sometime in 2013, so we are still counting up the figures for movies released late in the year. Warner Brothers and Disney are separated by only $9 million. Warner Brothers is actually down versus last week because of a downward revision in the domestic total for The Hobbit: Desolation of Smaug, while Disney is really benefiting from the very strong overseas and domestic performance of Frozen. For a complete ranking of 2013 films individually by worldwide performance click here.
We will begin tracking the 2014 Studio Scorecard in a few weeks.
YEAR TO DATE BOX OFFICE. Looking at North American box office, 2014 is now running 13% ahead of last year and 10% ahead of the average for the past four years ($373 million). Over the same period in this young year, Hollywood films have grossed $1.013 billion already when we add overseas box office. A reminder: we define the start of each year as the first Monday after New Year’s Day, and our year ends on the Sunday after New Year’s Day the following calendar year. (The most recent week’s numbers are based on weekend estimates, which are usually at worst a couple of percentage points off from the final weekend tallies.)
| Box Office YEAR TO DATE | |||
| (billions) | Weeks 1-2 | ||
| North America | Worldwide | ||
| 2014 | $0.410 | $1.013 | Jan 6-Jan 19 |
| 2013 | $0.362 | n/a | Jan 7-Jan 20 |
| 2012 | $0.384 | n/a | Jan 2-Jan 15 |
| 2011 | $0.318 | n/a | Jan 3-Jan 16 |
| 2010 | $0.428 | n/a | Jan 4-Jan 17 |
The past six weeks in North America are running 8% ahead of the same six weeks last year and 14% above the four-year average in the same time frame ($1.217 billion).
| North American Box Office LAST SIX WEEKS | ||
| (billions) | Week 49-Week 2 | |
| 2014 | $1.461 | Dec 9-Jan 19 |
| 2013 | $1.348 | Dec 10-Jan 20 |
| 2012 | $1.177 | Dec 5-Jan 15 |
| 2011 | $1.180 | Dec 6-Jan 16 |
| 2010 | $1.425 | Dec 7-Jan 17 |


